The email had six attachments and a sentence at the bottom: “everything you need is here.” Three CSV files from three different regional offices, two JSON responses saved from an internal API, an XML export from a legacy system nobody wanted to touch, an Excel workbook with five tabs, and a PDF report with two tables buried in the middle of eleven pages of commentary.
I had assumed, going in, that the actual analysis would be the hard part. It was not. Getting six sources into one shape a person could actually analyse took most of the week, and the analysis itself took an afternoon.
The real spectrum is structure, not file type
It helps to stop thinking about these as six unrelated problems and start thinking about where each one sits on a spectrum from structured to unstructured.
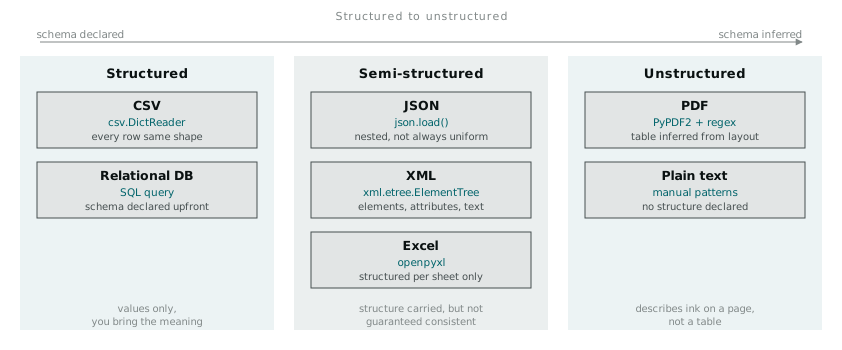
CSV sits at the structured end. Every row has the same number of fields, in the same order, and the format tells you nothing beyond the values themselves; you bring the meaning. JSON and XML sit in the middle. They carry their own structure (nesting, types in JSON’s case, attributes in XML’s case) but that structure is not guaranteed to be uniform across records, and it is not automatically tabular. Excel sits in a similar spot: structured within a sheet, but a workbook can hold five sheets with five different shapes, formulas that resolve to values you have to decide whether to trust, and merged cells that break the assumption that every row has a consistent number of columns. PDF sits at the unstructured end. A PDF is fundamentally a description of where ink goes on a page, not a description of what a table is. Any table structure you extract from one, you are inferring from the position of text, not reading from a declared schema.
That ordering matters because it predicts how much manual judgement each format needs. The CSV files needed almost none. The PDF needed a lot.
CSV: the format that lies about being simple
import csv

with open('regional_sales_north.csv', 'rb') as f:
    reader = csv.DictReader(f)
    rows = [row for row in reader]
CSV looks trivial until the encoding is wrong, or a field contains a comma inside quotes, or one of the three regional files uses semicolons instead of commas because whoever exported it had their Excel set to a European locale. Two of my three files opened cleanly with the default csv.reader. The third needed delimiter=';' explicitly passed in, and I only found that out because the row lengths coming back were wrong, not because Python raised an error telling me so.
with open('regional_sales_south.csv', 'rb') as f:
    reader = csv.DictReader(f, delimiter=';')
I stopped assuming a CSV is “just a CSV” after that. Every new file gets its first ten lines printed to the screen before I write a single line of parsing code against it.
JSON: nesting that does not map to rows
The two API responses came back as JSON, each with a slightly different shape, because they were pulled from two different endpoints of the same internal system by two different people who had not compared notes.
import json

with open('api_response_customers.json') as f:
    data = json.load(f)

rows = []
for record in data['results']:
    rows.append({
        'customer_id': record['id'],
        'name': record['attributes']['full_name'],
        'region': record['attributes']['region']['code'],
    })
json.load turns the file into nested Python dictionaries and lists in one call, and the actual work is walking that structure to pull out the fields you want. record['attributes']['region']['code'] is three levels of nesting to get one value, and every level is a place where a KeyError waits if a record does not have that field populated. I wrapped the extraction in a small helper using .get() with a default, rather than direct key access, once I hit the first record in the second file that had no region key at all:
region = record.get('attributes', {}).get('region', {}).get('code', 'UNKNOWN')That is defensive, and it is a little ugly to read. I would rather have an ugly line that survives a missing key than a clean one-liner that stops the whole batch on record 4,183 of 12,000.
XML: the format that makes you think about structure explicitly
The legacy export was XML, and unlike JSON’s dictionaries-and-lists shape, XML forces you to think in terms of elements, attributes, and text content as three separate things.
import xml.etree.ElementTree as ET

tree = ET.parse('legacy_export.xml')
root = tree.getroot()

rows = []
for record in root.findall('.//Record'):
    rows.append({
        'id': record.get('id'),  # attribute
        'status': record.find('Status').text,  # element text
        'amount': float(record.find('Amount').text),
    })
record.get('id') reads an XML attribute. record.find('Status').text navigates to a child element and reads its text content. These are genuinely different things in XML, and the legacy system used both inconsistently: some fields were attributes on the record tag itself, others were child elements one level down. There was no way to guess which was which without opening the file and looking. .//Record as an XPath expression means “find a Record element anywhere below this point,” which mattered here because records were nested two levels deeper than I expected on first read, inside a wrapping <Batch> element I had not noticed in the raw file.
Excel: five tabs, five different problems
import openpyxl

wb = openpyxl.load_workbook('quarterly_summary.xlsx', data_only=True)

for sheet_name in wb.sheetnames:
    ws = wb[sheet_name]
    for row in ws.iter_rows(min_row=2, values_only=True):
        # process row
        pass
data_only=True matters here specifically because several cells in the workbook held formulas, and without that flag openpyxl hands back the formula string itself (=SUM(B2:B14)) rather than the value the formula last evaluated to. min_row=2 skips the header row, but only because I checked that every sheet in this particular workbook had exactly one header row starting at row 1. One of the five tabs turned out to have two header rows, a merged title cell spanning the top of the sheet before the actual column headers began, and I had to handle that tab separately rather than assume the same min_row value applied uniformly across the workbook.
PDF: extraction is inference, not reading
The PDF was genuinely the hardest of the six, because a PDF does not know it contains a table. It knows where to draw text on a page.
import PyPDF2

reader = PyPDF2.PdfFileReader(open('quarterly_report.pdf', 'rb'))
text = ''
for page_num in range(reader.numPages):
    text += reader.getPage(page_num).extractText()
extractText() gives you a wall of text with the table structure gone, columns run together, and no reliable way to tell where one row ended and the next began beyond hunting for patterns in the whitespace. For the two tables I actually needed, I ended up combining extractText() with regular expressions matched against the specific layout of those two tables, since a generic parser had no way to know what I was looking for and I was not confident enough in PyPDF2’s table detection to trust it unsupervised. This is the one format in the set where I did not fully automate the extraction. I wrote a pattern tuned to these two specific tables, verified the row count matched what I could see by eye in the PDF viewer, and treated the result with more scepticism than anything that came out of the other five sources.
Bringing six shapes into one
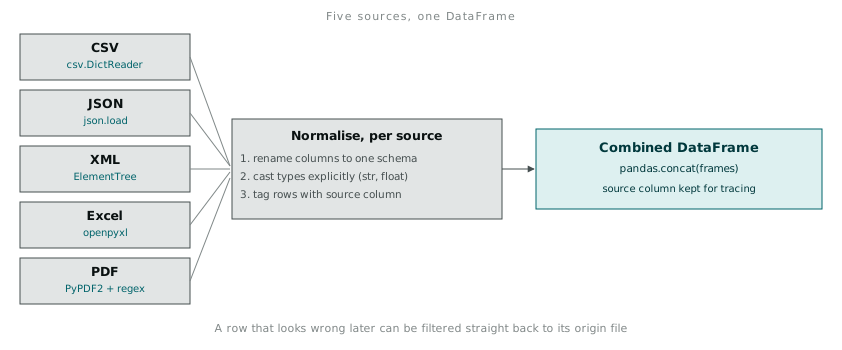
None of the individual parsers matter as much as what happens after each one runs: every source has to land in the same shape before you can do anything useful across them.
frames = []
for source_rows, source_name in [
    (csv_rows, 'csv'),
    (json_rows, 'json'),
    (xml_rows, 'xml'),
    (excel_rows, 'excel'),
    (pdf_rows, 'pdf'),
]:
    df = pandas.DataFrame(source_rows)
    df['source'] = source_name
    frames.append(df)

combined = pandas.concat(frames, ignore_index=True)
Column naming had drifted across every source before this point: customer_id in the JSON, CustID in one CSV, id as an XML attribute, a column literally labelled Cust. No. with a full stop and a space in the Excel tab. I built a small rename dictionary per source and applied it before concatenation, rather than trying to reconcile names after the fact across a combined frame where I could no longer tell at a glance which row had come from where. Type casting had the same problem: amounts came back as strings from the XML, floats from JSON, and a mix of both from Excel depending on how the original cell had been formatted. I cast every numeric column explicitly, source by source, before the concat rather than after, because pandas will happily concatenate a column of strings and a column of floats into one object-typed column that looks fine until you try to sum it.
Keeping the source column through to the final frame turned out to matter more than I expected. When a row looked wrong later in the analysis, being able to filter back to “which of the six files did this actually come from” saved a repeat of the whole extraction exercise just to find one bad row.