Someone on a project call last month asked whether I was “a data scientist or just an analyst,” and I did not have a clean answer. I have spent years pulling data out of systems that were not designed to give it up, cleaning it, joining it against things it was never meant to be joined against, and turning the result into a number someone in a meeting can act on. I did not know which side of that question my job sat on. Neither, as it turns out, does anyone else.
That question sent me looking for a definition. What I found was not one field with a settled name. It was three or four overlapping definitions, each written by a different kind of institution, each pulling the boundary in a slightly different place.
Three definitions, three audiences
The National Institute of Standards and Technology has a definition built for measurement. Their framing describes data science as the extraction of actionable knowledge from data, without being tied to a particular scale, tool, or domain. It reads like something written by people who need to standardise a discipline across government agencies, because it is. Broad, deliberately tool-agnostic, more concerned with the shape of the activity than with what you use to do it.
William Cleveland’s original 2001 proposal is older and narrower. He wanted statistics departments to treat data analysis as an engineering activity in its own right, with computing, modelling, and visualisation given equal academic weight instead of being treated as the boring plumbing underneath the “real” statistics. Cleveland was writing for statisticians who were sceptical to begin with, so the definition is careful and defensive. It reads like an internal memo trying to win a departmental argument.
O’Reilly’s version, popularised through Mike Loukides’ 2010 piece “What Is Data Science?”, is the one that actually shaped how the term got used in industry. It leans hard on scale and novelty: web logs, sensor data, the “data exhaust” that large systems throw off almost by accident, and the idea that new value comes from combining data sets nobody had previously thought to combine. That framing is why the term got attached so quickly to internet companies. It described what Google and Amazon were doing with their own operational data before anyone else had a name for it.
Three definitions. A standards body wanting rigour, a statistician wanting academic respect for the applied side of his field, and a publisher describing a commercial pattern he watched emerge at scale. None of them wrong. None of them describing the same thing.
Where I actually sit
Reading Harris, Murphy, and Vaisman’s 2013 survey (“Analyzing the Analyzers”) was the point where the gap stopped being abstract. They split the field into four rough types, based on a survey of people who call themselves data scientists.
The data businessperson sits closest to the commercial side: comfortable with data, but focused on what it means for the business, often without deep technical depth. The data creative is the generalist, someone who can move across the whole pipeline from raw extraction to a finished chart, without being the deepest specialist in any one part of it. The data developer is the one building the systems that move and store the data, closer to software engineering than to statistics. The data researcher is the one with the strongest maths and stats background, coming out of an academic pipeline, most comfortable with formal modelling.
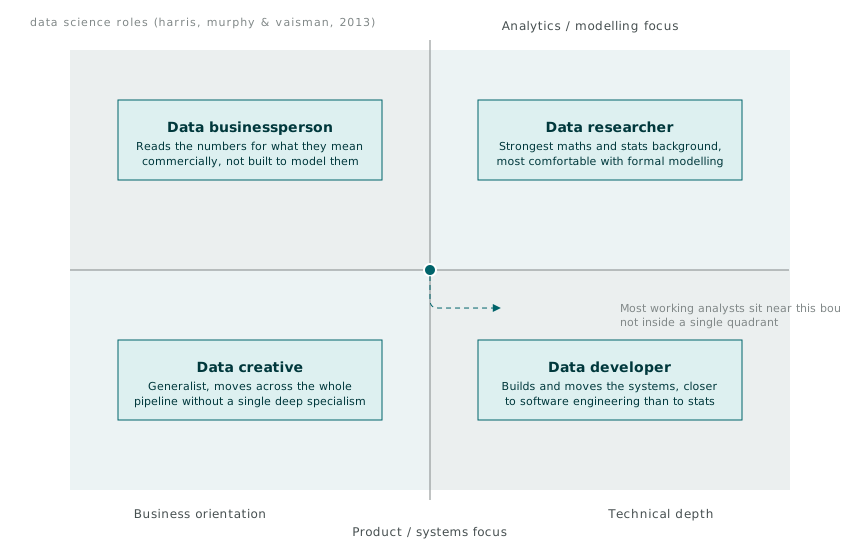
Looking at that chart, my own work sits somewhere between data creative and data developer. I move data between systems, I write the queries and the scripts that shape it, and I build the outputs that go in front of people who make decisions with them. I do not have the formal statistics training the data researcher quadrant assumes, and I am not deep enough into distributed systems to call myself an engineer in the way the data developer label implies either. I sit in the gap the survey draws between two labels, doing work that touches both.
That is not a personal failing. It is what the survey actually found: most people doing this work in practice sit between the tidy categories, not inside one of them. The taxonomy is useful for describing a spread of skills across a team. It is a poor fit for describing any one person’s job title.
The part nobody argues about
Underneath the disagreement about what to call the field, there is a sequence almost everyone agrees on, even when they use different words for the steps. Get the data. Get it into a shape you can work with. Look at it. Model it if the question calls for a model. Show someone the result. Have that result actually change what happens next.
I think of it as a chain, because on every project I have worked on, a break anywhere in that sequence breaks the whole thing. Perfect analysis on data nobody cleaned is worthless. A beautiful chart nobody acts on might as well not exist.
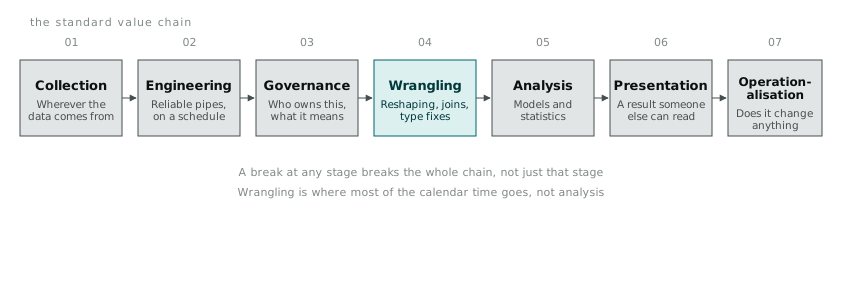
Collection is wherever the data physically comes from: a database export, a form, a sensor feed, a scraped page. Engineering is the plumbing that gets it moving reliably, on a schedule, without someone running a script by hand every Tuesday. Governance is the part everyone skips until something goes wrong: who owns this field, what does it actually mean, can we trust it. Wrangling is the unglamorous reshaping, the joins, the type coercions, the “why does this date column have three different formats” work that eats most of the calendar time on any real project. Analysis is where the models and statistics people picture when they hear “data science” actually happen, and it is often the smallest stage by time spent. Presentation turns a result into something a person who did not do the analysis can understand in under a minute. Operationalisation is whether any of it changes a decision, a process, or a system once the meeting is over.
I had been doing most of this work for a while before I had names for the stages. Naming them did not change what I do day to day. It changed how I talk about what I do, and it gave me a way to point at exactly where a project is stuck when someone asks why something that should take a week is taking a month. Almost every time, the answer is wrangling or governance, not analysis. Nobody ever budgets for those two properly, because the definitions that get quoted in job ads and conference talks skip straight past them to the modelling.
Why the label still matters
None of this would matter much if the label were only decorative. It is not. Job ads written around the O’Reilly framing ask for machine learning and big data infrastructure experience for roles that turn out, once you are in the seat, to be almost entirely wrangling and reporting. Job ads written around the Cleveland framing want someone with a formal statistics background for roles that barely touch inferential statistics at all. The mismatch between the label on the door and the work behind it wastes everyone’s time, on both sides of the hiring conversation.
I do not think the field needs one settled definition before it can be useful. Plenty of established disciplines carry internal disagreement about their own boundaries and still function fine. What I do think would help is more people being honest, in job ads and in conversation, about which of the four quadrants a role actually sits in, and which stage of the chain the work is mostly spent on. My own answer, for now: closer to data creative than data researcher, and closer to wrangling and presentation than to modelling. That is a smaller claim than “data scientist” usually implies. It is also a more accurate one.