I had a dataset of IGN game reviews (score, platform, genre, release year, a few thousand rows going back to the late 1990s) and a colleague who wanted to poke around in it without learning R. A static PDF of ggplot2 charts was not going to satisfy “can you show me just the PS4 exclusives from 2016” followed five minutes later by “actually, what about across all platforms, filtered to above an 8.” That is not a request for a chart. That is a request for an interface, and I had never built one in R.
R was never meant to run in a browser
The honest starting point is that R has no business serving web pages. It is an interpreted statistical language that expects a REPL, not HTTP requests. Shiny does not change that fact so much as it wraps around it: an R process stays running on a server, a browser connects to it over a persistent websocket, and every interaction (a dropdown changed, a slider dragged) gets sent back to that same running R session as a message, gets evaluated, and the result gets pushed back out as a UI update. The browser is a thin client. R is doing all of the actual work, the whole time, on someone’s machine, not the visitor’s.
That single fact explains a lot of what Shiny asks you to structure carefully. A traditional web app separates a stateless server handling requests from a client holding UI state. Shiny does not really have a stateless server. Each connected user gets their own live R session with its own memory, and that session persists exactly as long as the browser tab stays open, input$ values and all.
The convention for structuring an app is three files, and I stuck to it rather than inventing my own layout:
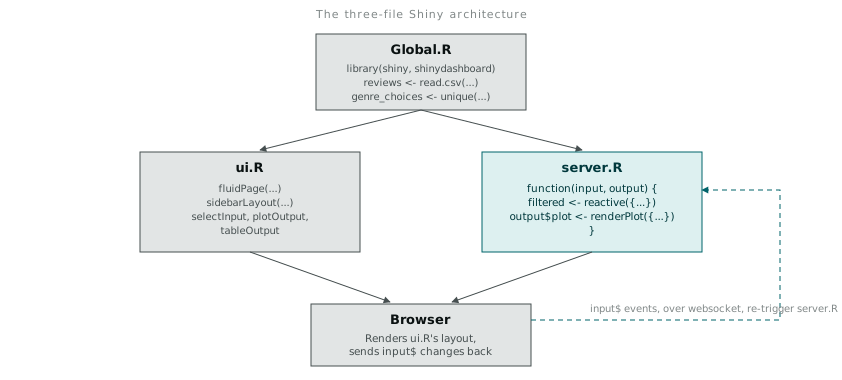
Global.R runs once, when the app starts, not once per visitor. That is where I loaded the review data and computed the list of genre and platform choices that both ui.R and server.R needed access to. Loading a CSV inside server.R instead would re-read the file from disk for every single visitor who opens the app, which I found out the slow way on an early version before I understood the distinction.
# Global.R
library(shiny)
library(shinydashboard)
library(plotly)

reviews <- read.csv("ign_reviews.csv", stringsAsFactors = FALSE)
genre_choices <- sort(unique(reviews$genre))
platform_choices <- sort(unique(reviews$platform))
ui.R describes layout and nothing else. No data logic lives here, only a declaration of what widgets exist and where output eventually gets drawn.
# ui.R
dashboardPage(
  dashboardHeader(title = "IGN Review Explorer"),
  dashboardSidebar(
    selectInput("genre", "Genre", choices = c("All", genre_choices)),
    selectInput("platform", "Platform", choices = c("All", platform_choices)),
    sliderInput("score_range", "Score range", min = 0, max = 10, value = c(0, 10))
  ),
  dashboardBody(
    plotlyOutput("score_histogram"),
    tableOutput("review_table")
  )
)
server.R is where the actual behaviour lives, and it is where the interesting part of Shiny sits.
The reactive graph is the thing worth understanding
My first instinct, coming from writing R scripts top to bottom, was to treat server.R as more of the same: a function that runs in order. That instinct is wrong, and it cost me a confusing afternoon before I properly understood what reactive() does.
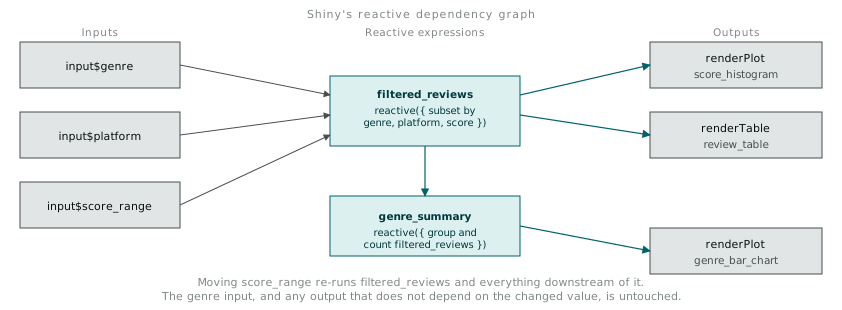
A Shiny server function does not execute once. Each render*() block, and each reactive() expression, gets re-run automatically whenever any input$ value it reads changes, and only then. Nothing is polling. Nothing is manually wired up with an event handler the way a traditional GUI callback would be. Shiny builds a dependency graph behind the scenes by tracking, at run time, which reactive values each expression actually touches, and it invalidates exactly the downstream nodes that depend on whatever changed.
# server.R
function(input, output) {

  filtered_reviews <- reactive({
    df <- reviews
    if (input$genre != "All") df <- df[df$genre == input$genre, ]
    if (input$platform != "All") df <- df[df$platform == input$platform, ]
    df <- df[df$score >= input$score_range[1] & df$score <= input$score_range[2], ]
    df
  })

  output$score_histogram <- renderPlotly({
    plot_ly(filtered_reviews(), x = ~score, type = "histogram")
  })

  output$review_table <- renderTable({
    head(filtered_reviews()[order(-filtered_reviews()$score), c("title", "platform", "score")], 10)
  })
}
Moving input$score_range re-runs filtered_reviews(), and because both outputs call filtered_reviews() rather than repeating the filtering logic themselves, both outputs update, but the filtering itself only happens once per change, not once per output. That was not obvious to me on the first draft. I had originally written the filtering logic separately inside renderPlotly and again inside renderTable, which worked, and which also meant every slider movement filtered the same data twice for no reason. Pulling the shared logic into one reactive() expression and having both outputs call it fixed the duplication and, more importantly, taught me what the abstraction is actually for. A reactive() expression is not just a memoised function. It is a node in a graph that Shiny manages the invalidation of on your behalf, so two different outputs reading the same reactive never desynchronise from each other, and never redo the same work twice on the same input change.
Where I stopped, deliberately
I did not reach for leaflet on this dataset, even though it is sitting in the same package ecosystem and gets used constantly for Shiny map dashboards. IGN reviews do not have a geospatial dimension worth plotting; forcing a map onto game platform data would have been decoration, not analysis, and I would rather leave a tool out than use it because it was available. plotly earned its place because hovering over a bar in the score histogram to see the actual count mattered more to my colleague than a static ggplot2 render would have, and wrapping an existing ggplot2 object in ggplotly() cost almost nothing.
I did spend time on the visual layer, mostly for a reason that has nothing to do with data. The default Shiny styling looks obviously like a default, and a stakeholder judges a dashboard’s credibility on sight before they judge the numbers in it. shinydashboard supports a skin parameter on dashboardPage() that changes the header and sidebar colour scheme in one line, at zero cost to the actual logic underneath. That felt like a slightly uncomfortable thing to admit mattered, and it clearly did.
dashboardPage(
  skin = "blue",
  dashboardHeader(title = "IGN Review Explorer"),
  ...
)
Deliberately breaking the dependency graph
Not every input should trigger a re-render the instant it changes, and Shiny gives you isolate() for exactly that case. I added a text box where a user could type a custom title for the exported chart, and left it wired directly into renderPlotly. Every keystroke re-ran the whole plot, which was pointless work and a visibly janky redraw mid-typing. Wrapping the read of that one input in isolate() tells Shiny “read this value, but do not treat it as a dependency,” so the plot stops listening to keystrokes while still listening to genre, platform, and score range as before.
output$score_histogram <- renderPlotly({
  title_text <- isolate(input$chart_title)
  plot_ly(filtered_reviews(), x = ~score, type = "histogram") %>%
    layout(title = title_text)
})
The trade-off is that the title now only updates the next time something else in the block re-runs, not the moment someone finishes typing. I paired it with an explicit “Apply” actionButton and made the button itself the dependency, rather than the text field, which fixed the staleness without bringing back the keystroke-triggered redraw. Deciding which inputs deserve automatic reactivity and which ones deserve to wait for an explicit action turned out to be a design decision about the app, not just a performance tweak.
The part that still catches me out
reactive() expressions are lazy. They do not run when defined, and they do not run just because something inside them changed if nothing downstream is currently asking for their value. I wrote a reactive() early on that computed a genre-level summary table, wired it up, then temporarily commented out the one tableOutput that displayed it while debugging something else. The summary reactive silently stopped running at all, which is correct behaviour and also not what I expected the first time I watched a print() statement inside it simply never fire. Nothing observing a reactive value means nothing evaluating it, no matter how many inputs it nominally depends on. I now think of a reactive expression less like a variable and more like a standing subscription: it does work only for as long as, and only because, something else is still listening.
That distinction between “this variable holds a value” and “this expression exists only because something downstream needs it” is not a distinction ordinary R scripting ever forces you to make. It is the whole shape of the Shiny model, and once it clicked, the rest of the framework (the three files, the automatic re-rendering, the lack of explicit event handlers anywhere in the code) stopped looking like magic and started looking like the direct, fairly simple consequence of one idea taken seriously.