A join can only tell you so much about a flight delay dataset before the questions stop being tabular. “Which airports have the worst average delay” is a groupBy. “Which airports sit at the centre of the delay network, propagating disruption outward to the most connected neighbours” is not a question a row-and-column table answers cleanly, because the thing that matters is not the airport, it is the airport’s position relative to every other airport it connects to. That is a graph question, and I reached for Spark GraphX to ask it properly.
Why a table is the wrong shape here
The dataset was a year of US domestic flight records in CSV, one row per flight: origin, destination, carrier, scheduled departure, arrival delay in minutes, distance. A DataFrame handles this fine for per-flight or per-route aggregates. What it cannot do without contortion is answer questions about the network itself, how many hops separate two airports, which carrier’s routes overlap most with another’s, which airport, if it shut down for a day, would strand the most connected traffic. Those all depend on the structure between records, not the records in isolation, and GraphX exists because Spark’s authors ran into the same wall.
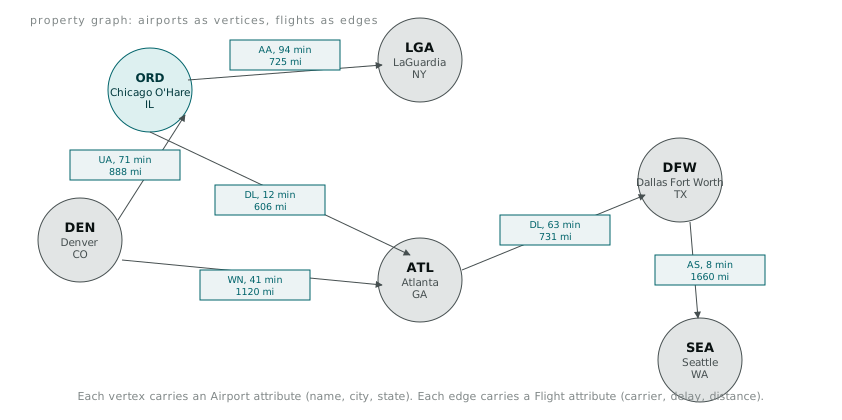
GraphX represents a graph as two RDDs bolted together: a VertexRDD of vertices, each with an ID and an attribute, and an EdgeRDD of edges, each with a source ID, a destination ID, and its own attribute. Airports became vertices. Flights became edges. Everything else followed from that.
Building vertex IDs that are not just row numbers
GraphX wants vertex IDs as Long, and airport codes are three-letter strings like MEL or JFK. I could have assigned integers sequentially, but that meant keeping a lookup table around everywhere I wanted to go from a vertex ID back to an airport code, and sequential IDs are not stable if the airport list changes between runs. I used a hash of the airport code instead, MurmurHash3, which is deterministic and fast enough not to matter at this scale.
import org.apache.spark.graphx._
import org.apache.spark.rdd.RDD
import scala.util.hashing.MurmurHash3

def airportId(code: String): VertexId = {
  MurmurHash3.stringHash(code).toLong
}

case class Airport(code: String, name: String, city: String, state: String)
case class Flight(carrier: String, delayMinutes: Int, distance: Int)

val airportsRDD: RDD[(VertexId, Airport)] = sc.textFile("airports.csv")
  .map(_.split(","))
  .map(cols => (airportId(cols(0)), Airport(cols(0), cols(1), cols(2), cols(3))))

val flightsRDD: RDD[Edge[Flight]] = sc.textFile("flights.csv")
  .map(_.split(","))
  .map(cols => Edge(
    airportId(cols(0)),          // origin
    airportId(cols(1)),          // destination
    Flight(cols(2), cols(3).toInt, cols(4).toInt)
  ))

val flightGraph: Graph[Airport, Flight] = Graph(airportsRDD, flightsRDD)
Graph(vertices, edges) is the constructor GraphX gives you once both RDDs exist. It handles the case where an edge references a vertex ID not present in the vertex RDD by creating a default vertex, which caught a data quality issue I had not noticed: three airport codes appearing in flights.csv that were missing entirely from airports.csv, almost certainly small regional airports the metadata file had not kept up with.
Triplets: where a graph stops feeling like two separate RDDs
The construct that made GraphX click for me was the triplet, EdgeTriplet, which joins an edge to both its source and destination vertex attributes in one object. Without triplets, answering “show me every flight with over sixty minutes delay along with both airport names” means manually joining the edge RDD against the vertex RDD twice, once per endpoint. With triplets, GraphX has already done that join.
val badDelays = flightGraph.triplets.filter(triplet => triplet.attr.delayMinutes > 60)

badDelays.map(triplet =>
  s"${triplet.srcAttr.name} -> ${triplet.dstAttr.name}: ${triplet.attr.delayMinutes} min (${triplet.attr.carrier})"
).take(5).foreach(println)
Chicago O'Hare -> LaGuardia: 94 min (AA)
Denver -> Chicago O'Hare: 71 min (UA)
Atlanta -> Dallas Fort Worth: 63 min (DL)Under the hood, triplets is still a join between the edge RDD and the vertex RDD, GraphX has not invented a way around Spark’s usual join cost. What it does is keep the vertex attributes co-partitioned with the edges that reference them where it can, so repeated triplet operations do not re-shuffle the same join every time. The first triplets call still pays for it. Subsequent graph operations on the same graph benefit from the routing table GraphX built along the way.
Degree and connectivity, without writing the traversal myself
Two of the built-in graph operators did most of the analysis I actually wanted, with no hand-rolled BFS involved.
val outDegrees = flightGraph.outDegrees
val inDegrees = flightGraph.inDegrees

val busiest = outDegrees.join(airportsRDD)
  .map { case (id, (degree, airport)) => (airport.code, degree) }
  .sortBy(_._2, ascending = false)

busiest.take(5).foreach(println)
outDegrees and inDegrees return a VertexRDD[Int], the count of outgoing or incoming edges per vertex, which for this dataset means the number of distinct route-days each airport originates or receives. Joining that back against the airport metadata and sorting gave a busiest-airports ranking in four lines, no manual grouping logic and no need to think about how the aggregation is distributed across partitions, GraphX’s VertexRDD already knows how to aggregate per-vertex values efficiently because it tracks vertex-to-partition routing separately from the edge data.
Connected components, flightGraph.connectedComponents(), found something more interesting: a small cluster of four regional airports that only connected to the main network through a single carrier’s single daily route. Losing that one route would have split them off from the rest of the network entirely, the kind of fragility a per-flight table would never surface because no single row shows the shape of the whole graph around it.
The CSV-versus-Parquet gap I was not expecting
None of the graph work above was slow. What was slow, and what taught me something unrelated to graphs entirely, was reloading the same flight data repeatedly while I iterated on the vertex ID scheme. Each sc.textFile("flights.csv").map(_.split(",")) reparsed the whole file as text, every field going through string splitting and type coercion again.
I converted the same dataset to Parquet once, using a quick DataFrame round-trip, and reloaded from that instead.
spark.read.option("header", "true").csv("flights.csv")
  .write.parquet("flights.parquet")

val flightsDF = spark.read.parquet("flights.parquet")
The difference was not subtle. The CSV file was 340MB. The Parquet version of the same data came out at 96MB, columnar storage with compression doing real work on repeated carrier codes and delay values. Read time for a full scan dropped from around 38 seconds to 9. A filtered query, delays over 60 minutes, dropped further still, because Parquet stores column statistics per row group and can skip whole blocks that cannot contain a matching value, something a line-by-line CSV parse has no way to do. An aggregate query, average delay by carrier, showed the same pattern: CSV forced a full text parse of every row before any aggregation could start, Parquet let Spark read only the two columns the aggregate actually needed.
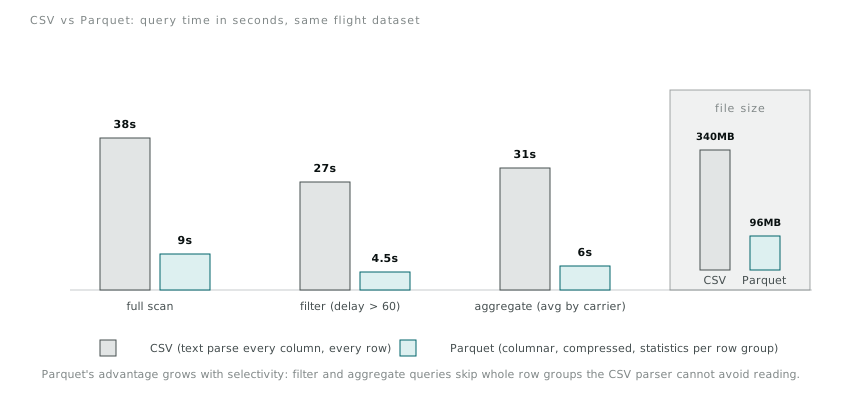
None of this changed the graph itself. It changed how I load anything I plan to touch more than once. CSV is fine for a one-off scan or for handing a file to someone who needs to open it in a spreadsheet. For anything iterative, anything I intend to query more than a single time, converting to Parquet up front now happens before the interesting work starts, not as an afterthought once the CSV parsing has already eaten a third of the session.
The graph itself confirmed what I suspected going in: the flight network has a small number of hub airports carrying a disproportionate share of both traffic and connectivity, and the delay concentrated there matters more to the network’s resilience than delay at any single small regional route. That is not a novel finding in aviation. It is, however, exactly the kind of question a table alone would have made me guess at rather than measure.