Forty-seven DAX measures. Twelve table relationships. Three calculation groups. One TE2 C# script. I reviewed the plan, approved it, and Tabular Editor 2 applied every change to the Fabric semantic model in a single execution. No manual clicking through the Power BI interface. No copy-pasting DAX formulas between measure dialogs. No fat-finger errors in relationship cardinality settings.
The script took eleven seconds to run. Building the same set of measures manually would have taken the better part of a day, assuming no mistakes.
This was report seventeen of twenty-five in a large-scale Microsoft Fabric reporting project. By this point, the workflow had settled into a pattern I now think of as loop engineering: a structured, repeating cycle where an AI agent proposes, a harness constrains, a human approves, and tooling executes.
The distinction matters. This is not prompt engineering. I did not spend hours crafting the perfect prompt. I spent hours building the system around the agent so that a mediocre prompt produces a reliable output.
The toolchain
The development workflow combines four tools, each with a specific role:
Claude Opus via GitHub Copilot Enterprise. The AI agent. Accessed through VS Code chat. Handles the analytical work: reading stakeholder requirements, proposing DAX measures, generating TE2 C# scripts, suggesting relationship structures, and drafting documentation. The agent does not have access to the live Fabric environment. It works from context provided in the project files.
Tabular Editor 2 (TE2). The execution layer. TE2 connects directly to Fabric semantic models and supports C# scripting for bulk operations. A single script can create, modify, or delete measures, relationships, calculated columns, hierarchies, and role-level security rules. TE2 was specifically chosen over Tabular Editor 3 because TE2 supports the C# scripting interface natively. TE3 moved to a different scripting model that does not offer the same batch operation capability.
DAX Studio. The validation layer. After TE2 applies changes, DAX Studio connects to the semantic model to verify measure outputs. Spot-checking values against known results, profiling query performance, and confirming that Direct Lake is not falling back to DirectQuery for critical measures.
VS Code. The orchestration surface. All project files (agents.md, stakeholder docs, memorybank, generated scripts) live in a VS Code workspace. The AI agent operates within this workspace, with full visibility of the project structure, conventions, and context.
The agents.md file
Every project has configuration files. This one has a single file at the project root that governs how every artefact is built.
project-root/
├── agents.md          # project-level harness
├── report-*/
│   ├── docs/          # stakeholder requirements
│   ├── memorybank/    # implementation context
│   ├── model/         # semantic model definitions
│   └── ...
The agents.md file defines:
-
Naming conventions. Measure names follow a
[Category] Measure Namepattern. Table prefixes distinguish facts from dimensions. Column names use title case with no abbreviations. These conventions are not optional. They are hard constraints that every agent interaction must respect. -
DAX style rules. Formatting standards for readability: one clause per line, explicit RETURN statements, variable naming with
_prefixes for intermediate calculations. Consistent formatting means every measure looks like it was written by the same person, regardless of whether it was written by a human or an AI agent. -
Relationship principles. Star schema by default. No bidirectional relationships without documented justification. Fact-to-dimension only. Many-to-many requires a bridge table and a comment explaining why.
-
Data modelling rules. Calculation groups for time intelligence (never individual YTD/PY/MTD measures). Measure tables grouped by analytical domain. No implicit measures (every measure is explicit and documented).
-
Documentation requirements. Every measure includes a description. Every relationship includes a grain statement. Every calculation group includes usage guidance.
This file is not a prompt. It is a harness. The difference between a harness and a prompt is the difference between a guardrail and a suggestion. A prompt says ‘please follow these conventions.’ A harness makes it structurally difficult to violate them.
When the AI agent generates a TE2 script, the harness ensures the output conforms to project standards. If the agent proposes a bidirectional relationship, the harness says that requires justification. If the agent names a measure without the category prefix, the harness catches it in review. The harness does not make the agent perfect. It makes the agent’s mistakes predictable and catchable.
The workflow: plan, review, execute, validate
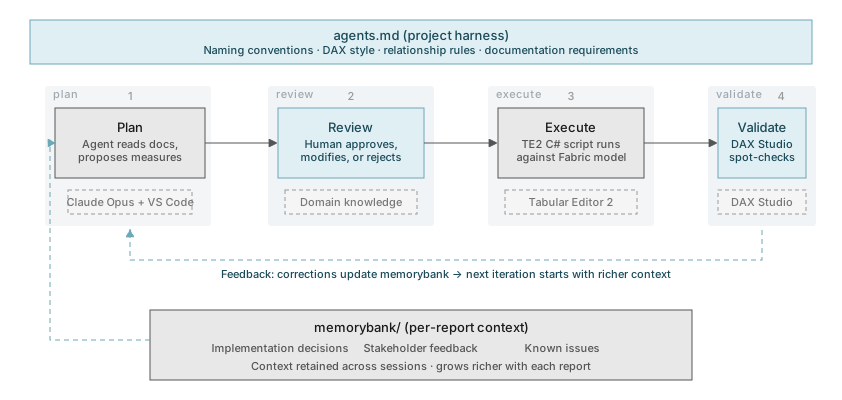
Each report follows a four-phase cycle. The cycle repeats for every batch of measures or model changes.
Phase 1: Plan
The agent reads the stakeholder requirements from the report’s docs/ folder, the existing model definitions from the model/ folder, and the project harness from agents.md. It proposes:
- Which measures need to be created
- Which relationships need to be added or modified
- Which calculation groups apply
- How the new measures relate to existing ones
The output is a structured plan, not code. Measure names, descriptions, DAX logic in pseudocode, relationship definitions, and dependency notes. This plan is the conversation, not the execution.
Phase 2: Review
I review the plan against my understanding of the data and the business requirements. This is where domain knowledge matters. The agent can propose a revenue variance measure, but it cannot know that the finance team considers ‘revenue’ to exclude internal recharges unless that constraint is documented. If it is not documented, I add it to the memorybank so the next iteration includes it.
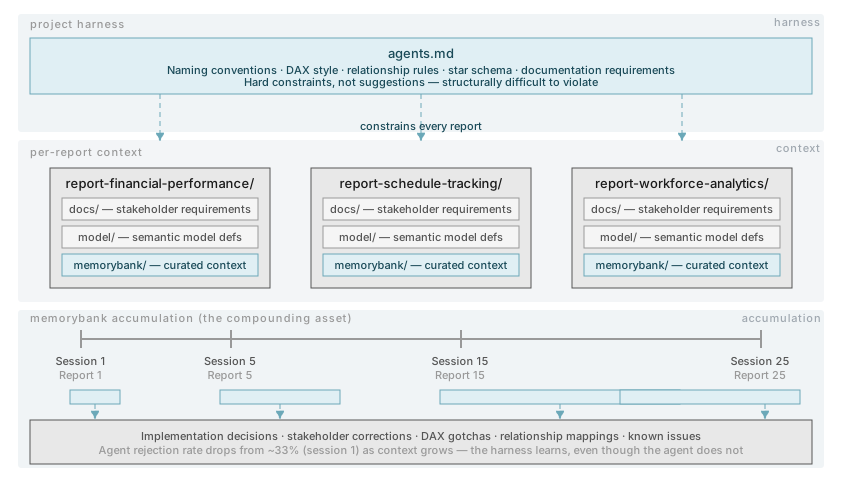
The review phase is not rubber-stamping. On average, I modify or reject about a third of proposed measures in the first pass. The rejection rate drops over time as the memorybank accumulates context. By report twenty, the agent’s first-pass accuracy on measure definitions is noticeably better than it was at report five, because the project’s documentation has grown to cover edge cases that earlier reports surfaced.
Phase 3: Execute
Once the plan is approved, the agent generates a TE2 C# script. A typical script for a medium-complexity report looks like this:
// Create measures for financial performance
var model = Model;
var table = model.Tables["_Measures Financial"];

// Cost Performance Index
var cpi = table.AddMeasure("CPI");
cpi.Expression = @"
DIVIDE(
    [Earned Value],
    [Actual Cost],
    BLANK()
)";
cpi.Description = "Cost Performance Index. Above 1.0 indicates under budget.";
cpi.FormatString = "0.00";
cpi.DisplayFolder = "Earned Value";

// Schedule Performance Index
var spi = table.AddMeasure("SPI");
spi.Expression = @"
DIVIDE(
    [Earned Value],
    [Planned Value],
    BLANK()
)";
spi.Description = "Schedule Performance Index. Above 1.0 indicates ahead of schedule.";
spi.FormatString = "0.00";
spi.DisplayFolder = "Earned Value";

// ... dozens more measures follow
The script runs in TE2 against the live Fabric semantic model. Every measure, relationship, and property change applies in one pass. No manual intervention between items. If the script defines forty-seven measures, forty-seven measures appear in the model after a single execution.
TE2’s C# scripting is the critical enabler. Power BI Desktop does not offer a scriptable interface for bulk model changes. The Fabric web interface does not either. TMDL (Tabular Model Definition Language) can represent the model declaratively, but applying changes still requires tooling. TE2 bridges the gap: it connects to Fabric, exposes the Tabular Object Model via C#, and executes scripts against the live semantic model.
Phase 4: Validate
After the script runs, I open DAX Studio and connect to the updated semantic model. Validation checks:
-
Measure accuracy. Run each new measure against known data points. If the finance team says Q3 revenue was $4.2M, the revenue measure had better return $4.2M for Q3.
-
Relationship correctness. Query across the new relationships to verify that filters propagate correctly. A common mistake: setting the wrong cross-filter direction, which silently produces incorrect aggregations.
-
Direct Lake compatibility. Check whether any new measures trigger DirectQuery fallback. Complex DAX patterns (certain uses of USERELATIONSHIP, nested CALCULATE with multiple filter modifications) can cause Direct Lake to fall back to DirectQuery mode, which is significantly slower. DAX Studio shows this in the query plan.
-
Performance. Time the most expensive measures. Anything over two seconds in DAX Studio will be worse in a multi-visual report layout. Optimise before it reaches the stakeholder.
Why this is loop engineering, not prompt engineering
Prompt engineering optimises a single interaction. You refine the prompt until it produces a good output for one request. That has value for one-off tasks.
Loop engineering optimises the system around the interaction. The agents.md harness. The memorybank that accumulates context. The review phase that catches what the harness misses. The validation phase that catches what the review misses. Each phase feeds back into the others. The harness tightens. The memorybank grows. The agent’s proposals improve because the context it reads is richer.
I built a similar loop for a property sale campaign with a different domain but the same structural pattern: specialised agents, compliance gates, a harness that constrains, a human who approves. The tools change (TE2 instead of a web publisher, DAX instead of listing copy, Fabric instead of real estate portals), but the pattern holds.
The key insight from applying this across both projects: the harness is the product, not the prompt. When I move to report twenty-six, the harness comes with me. The prompts are disposable. The harness is the compounding asset.
The memorybank
Each report subfolder contains a memorybank/ directory that retains context across development sessions. This solves a specific problem: AI agents do not remember previous conversations. Without the memorybank, every session starts from zero. The agent re-reads requirements, re-proposes measures it already defined, and makes the same mistakes it made last time.
The memorybank stores:
-
Implementation decisions. ‘Chose SUMX over CALCULATE for this measure because the grain requires row-level evaluation.’ These notes prevent the agent from proposing a simpler (and incorrect) alternative in a future session.
-
Stakeholder feedback. ‘Finance team confirmed that internal recharges are excluded from revenue totals. Updated measure definition on 14 March.’ Context the agent needs but cannot discover from the data alone.
-
Known issues. ‘Direct Lake falls back to DirectQuery on the rolling 12-month variance measure. Accepted for now; optimise if query time exceeds threshold.’ Prevents the agent from attempting to ‘fix’ a known and accepted trade-off.
-
Relationship mappings. ‘Project ID in the financial table maps to Programme Code in the scheduling table via the bridge table dim_project_mapping.’ Cross-source relationships that are not obvious from column names alone.
The memorybank is not a chat log. It is curated context: the decisions, constraints, and domain knowledge that make the difference between an agent that starts from scratch and an agent that picks up where the last session ended.
What this produced
Across twenty-five reports over twelve months:
-
Hundreds of DAX measures defined via TE2 C# scripts. The exact number varies by report complexity, but the largest single model contains over 120 measures, all created through the plan-review-execute-validate cycle.
-
Cross-report consistency. Because every measure is generated against the same harness, naming conventions, formatting standards, and documentation patterns are uniform across the project. A developer opening report twenty-five for the first time finds the same structure as report one.
-
Reduced manual errors. Bulk script execution eliminates the class of errors that come from manual entry: typos in DAX formulas, wrong column references, incorrect filter contexts set through the UI. If the script is correct, the execution is correct.
-
Faster iteration. A new batch of measures for a report goes from stakeholder requirement to validated model in hours, not days. The limiting factor is the review phase (human cognition), not the execution phase (TE2 scripting).
-
Growing harness quality. The agents.md file and the per-report memorybanks are richer at month twelve than they were at month one. Every edge case, every stakeholder correction, every DAX gotcha is documented and available to every future session. The system learns, even though the agent itself does not retain memory.
Trade-offs and honest limits
The agent still gets DAX wrong. Complex time intelligence, particularly calculations involving custom fiscal calendars or non-standard date hierarchies, trips the agent up regularly. It produces DAX that is syntactically correct but semantically wrong (the formula runs but returns the wrong number). The validation phase catches these, but they require manual correction. I do not trust the agent for complex DAX without line-by-line review.
Review is non-negotiable. The plan-review-execute-validate cycle has four phases for a reason. Removing the review phase would save time and introduce errors that surface in stakeholder meetings. The agent is a productivity multiplier, not a replacement for understanding the data model.
GitHub Copilot Enterprise dependency. The workflow depends on a paid subscription for the AI agent capability. The cost of token-based AI tooling is a consideration, though for this project the productivity gain justified the spend comfortably.
TE2, not TE3. Choosing Tabular Editor 2 over Tabular Editor 3 was driven by the C# scripting requirement. TE3 is a more polished product with better UI, but its scripting model does not support the same bulk operations. This is a genuine trade-off: better developer experience (TE3) versus better automation capability (TE2). For a project at this scale, automation wins.
Not every report benefits equally. Simple reports with five measures and one fact table do not justify the overhead of the full loop engineering workflow. The plan-review-execute-validate cycle has fixed costs (writing the plan, reviewing, validating). For a small report, manual entry in Power BI Desktop is faster. The workflow earns its keep at roughly fifteen or more measures per report.
The pattern beyond Fabric
The specific tools in this workflow are Microsoft-centric: Fabric, TE2, Power BI, DAX. The pattern is not.
Any domain where you need to produce a large volume of structured artefacts against a set of constraints is a candidate for loop engineering. Database migration scripts. Terraform modules. API endpoint definitions. Test fixtures. Configuration files. The ingredients are the same: an AI agent that proposes, a harness that constrains, a human who approves, and tooling that executes.
The harness is portable. I have reused the structural pattern (a central constraints file, per-context memory, plan-review-execute-validate cycles) across projects with completely different technology stacks. The constraints change. The workflow does not.
The part that surprises people: the harness improves faster than the agent does. Model capabilities advance on the provider’s schedule. Harness quality advances on yours, every session, compounding from the first day.
That compounding is the point.