I have solved most of my data problems by feel. Look at what is available, pick the tool I already know for the part that looks hardest, and work backward from there until something ships. It has worked well enough that I never questioned it until a friend running a small hotel asked me, over a beer, how she should be setting her room rates. She was doing it the way most independent operators do: check what the two hotels down the road are charging, undercut them slightly on weekdays, charge whatever the market will bear on weekends. I told her that sounded like a real data problem. Then I sat down to solve it and, instead of reaching for whatever tool came to mind first the way I usually do, I tried running it through the Standard Value Chain deliberately, stage by stage, and picking the right tool for each one rather than the familiar one.
The business question, stated properly
Dynamic pricing for a hotel room is the same problem an airline solves for a seat: a fixed, perishable inventory (a room unsold tonight earns nothing, ever, it does not carry over) sold to buyers with different willingness to pay depending on how far ahead they are booking, what is happening in the city that week, and what competing properties are charging. The goal is to set a price for each room, each night, that maximises revenue across the whole inventory rather than maximising the rate on any single booking.
That is a demand forecasting and price optimisation problem before it is a database problem, and the temptation is to jump straight to the forecasting model. Running it through the value chain first meant asking a duller question before that: where does every piece of information this model would need live, and is any of it usable in its current form.
Stage one: collection, and four sources that do not talk to each other
The property management system, the software the front desk uses to manage bookings, holds the hotel’s own occupancy history: which rooms sold, at what rate, how far in advance, cancelled or not. That is the core of the dataset and the one source fully under the hotel’s control.
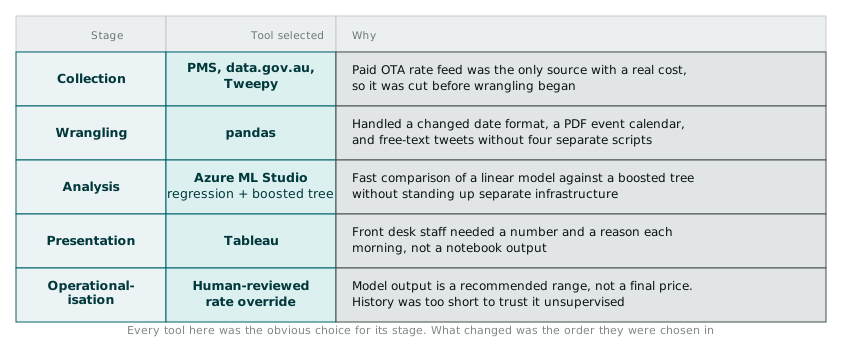
The OTAs (Expedia, Booking.com, and similar) show current asking rates for competing properties, visible to anyone browsing the site but not exposed as a clean feed unless the hotel pays for one of the rate-intelligence products built on top of OTA data. My friend’s hotel does not have that budget, which meant this source would have to be collected by hand or scraped, and scraping OTA listing pages sits close enough to a breach of most of their terms of service that I ruled it out for anything beyond an occasional manual spot check.
data.gov.au turned out to be a genuinely useful third source I had not expected going in. Tourism Research Australia publishes visitor arrival statistics and event calendars through the portal, and a capital city’s convention centre publishes its own schedule of confirmed events, both useful for spotting demand spikes weeks or months ahead rather than reacting to a spike in real time.
Twitter was the fourth source, and the least reliable of the four. The idea was that geotagged and keyword-matched tweets mentioning the city, an event, or a flight delay might work as an early, noisy signal of demand before it showed up anywhere official. I pulled a sample using Tweepy, Python’s wrapper around the Twitter API, and the signal was there but thin: useful as a secondary confirming variable, not something I would base a pricing decision on by itself.
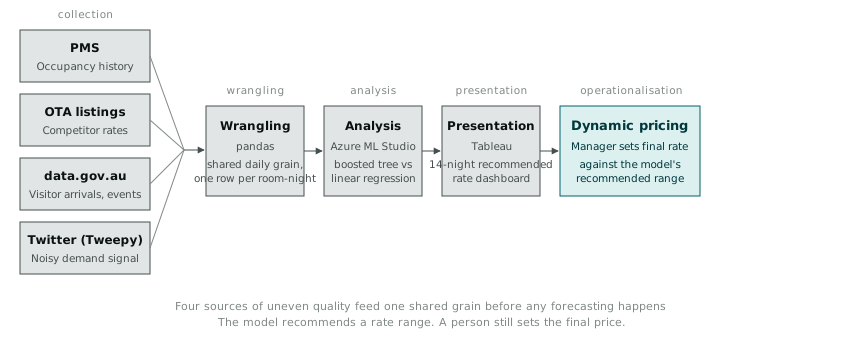
Four sources, three of them structured to some degree and one of them deliberately noisy, and already the collection stage alone had ruled out a fifth option (a paid rate-intelligence API) purely on cost, before a line of analysis code existed.
Stage two: wrangling, and the stage that ate the week
The PMS export came out of the system as a CSV with a date format that changed twice across an eighteen-month history, evidence of a system migration nobody had documented. The event calendar from the convention centre was a PDF, which meant extracting a usable table from it before it was worth anything. The data.gov.au visitor arrivals data was clean by comparison, published as tidy CSV files with consistent columns, and the Twitter sample needed the usual text cleanup: stripping URLs, normalising hashtags, deduplicating retweets.
I did all of this in pandas, because Python’s ecosystem for exactly this kind of heterogeneous, badly-typed wrangling was the strongest option on the table and I was not going to write custom parsing logic in a spreadsheet formula for a PDF-derived event calendar. Getting four sources onto a shared daily grain, one row per room-night with occupancy, competitor signal, event flag, and social signal all joined against the same date, took most of the time on the project. It was not a surprise that it did. Every value chain diagram I have read puts wrangling in the middle as though it is a quick stop on the way to analysis, and every real project I have worked has told me otherwise.
Stage three: analysis, where the actual forecasting happens
With a clean daily table, the analysis stage was a demand forecasting problem: given the day of week, days until arrival, event flags, and recent booking pace, what occupancy and what achievable rate should this hotel expect for a given future date. I used Azure Machine Learning Studio for this, partly because it was the tool I had available with a fast path from a clean dataset to a working regression model without standing up separate infrastructure, and partly because the drag-and-drop experiment pipeline made it fast to try a linear regression against a boosted decision tree and compare them without rewriting the whole pipeline for each attempt.
The boosted tree model beat plain linear regression on this dataset, unsurprisingly, given the number of non-linear interactions in play (an event flag matters far more on a night that would otherwise be quiet than on a night that was already going to sell out regardless). I do not want to overstate what a few months of historical PMS data from one small property can support. It is not enough history to trust a model with confident, high-stakes pricing decisions on its own, and I treated the model’s output as one input into a recommended rate range a human still reviews, not as an automated pricing engine, deliberately, because the data behind it was not strong enough yet to hand the decision over.
Stage four: presentation, and stage five: operationalising a number
A forecasted rate range sitting in a Jupyter-style notebook output is not something the front desk manager can use at seven in the morning while setting tomorrow’s rate. I built the presentation layer in Tableau: a dashboard showing tonight’s and the next fourteen nights’ recommended rate range against the model’s confidence, the competitor rate where I had a manual spot check on hand, and any event flags driving an unusual recommendation. The manager’s actual workflow did not change dramatically. She still sets the final rate herself. What changed is that she now has a specific number and the reason behind it in front of her each morning, instead of a gut feel and a glance at the two hotels down the road.
What the framework changed
Solving this by feel, the way I usually do, I would have opened a notebook and started building a forecasting model within the first hour, because forecasting is the part that looks like the interesting problem. Running it through the value chain first meant I spent that first hour on collection and wrangling questions instead, and the project was better for the delay. The OTA scraping decision I ruled out on legal grounds would have cost real time to discover the hard way if I had built a scraper first and asked the terms-of-service question second. The two rounds of date format inconsistency in the PMS export would have silently corrupted a chunk of the training data if I had joined the sources before I had looked at each one individually.
None of the tool choices here were exotic. Pandas for wrangling, Azure ML for a first-pass model, Tableau for the dashboard, all reasonably obvious once the stage they were solving for was clear. What the framework changed was not which tools I reached for. It was the order I reached for them in, and the discipline of treating each stage as a decision worth making deliberately rather than a formality on the way to the model I already wanted to build.